Market Movers
sensex
28129.97123.33(0.44%)
nifty
8677.6053.55(0.62%)
| DAX (Aug 18) | 10591.32 | 53.65 | 0.51% |
|---|---|---|---|
| CAC (Aug 18) | 4431.46 | 13.78 | 0.31% |
| FTSE (Aug 18) | 6874.17 | 15.02 | 0.22% |
| S&P BSE Auto | 21526.21 | 71.65 |
|---|---|---|
| S&P BSE BANKEX | 22195.72 | 358.34 |
| Bank Nifty | 19352.80 | 311.55 |
| S&P BSE Capital Goods | 15068.48 | -63.88 |
| S&P BSE Consumer Durables | 12085.28 | -58.88 |
| S&P BSE FMCG | 8699.56 | -10.03 |
| S&P BSE Healthcare | 16202.76 | 114.56 |
| S&P BSE IT | 10589.54 | -30.88 |
| S&P BSE Metals | 10043.48 | -55.30 |
| S&P Oil & Gas | 10778.63 | 81.19 |
| S&P BSE PSU | 7457.49 | 74.11 |
| S&P BSE TECk | 5816.11 | -1.17 |
| S&P BSE Small Cap | 12403.69 | 123.49 |
| S&P BSE Mid-Cap | 12967.71 | 56.10 |
| Nifty Midcap 100 | 15098.30 | 114.40 |
| Company | Price | % Gain |
|---|---|---|
| UltraTechCement | 3,874.35 | 4.73 |
| Power Grid Corp | 182.00 | 4.21 |
| IndusInd Bank | 1,194.60 | 3.56 |
| NTPC | 166.80 | 3.25 |
| Adani Ports | 275.45 | 2.91 |
| Company | Price | % Loss |
|---|---|---|
| Coal India | 339.05 | -2.52 |
| Larsen | 1,482.10 | -1.36 |
| Tata Power | 76.90 | -1.35 |
| Tata Steel | 387.20 | -1.19 |
| Tech Mahindra | 469.50 | -1.90 |
Asia
| Nikkei 225 (Aug 18) | 16486.01 | -259.63 |
|---|---|---|
| Straits Times (Aug 18) | 2836.98 | -6.34 |
| Hang Seng (Aug 18) | 23023.16 | 223.38 |
| Taiwan Index (Aug 18) | 9122.50 | 4.80 |
| KOSPI (Aug 18) | 2055.47 | 11.72 |
| Shanghai Composite (Aug 18) | 3104.32 | -5.23 |
Europe
| FTSE (Aug 18) | 6863.79 | 4.64 |
|---|---|---|
| CAC (Aug 18) | 4421.19 | 3.51 |
| DAX (Aug 18) | 10573.80 | 36.13 |
Event Calendar
Profit from the markets
-

May see RBI cut rates by 25-50 bps over next 9 months: Birla AMC
- * trading calls
- * cutting edge
- * updates
-

Rio 2016: CAS Overturns NADA's Decision, Narsingh Yadav Banned for 4 years
- * trading calls
- * cutting edge
- * updates


News Flash
- Sun Pharma : Imatinib Mesylate Is Therapeutic Equivalent To Gleevec.
- Balaji Tele : To Mull Fundraising Via Issue Of Securities On Pref Basis On February 4
- Rel Capital : Imatinib Mesylate Is Therapeutic Equivalent To Gleevec
- Sun Pharma : To Mull Fundraising Via Issue Of Securities On Pref Basis On February 4
- Rel Capital : Imatinib Mesylate Is Therapeutic Equivalent To Gleevec
- Balaji Tele : To Mull Fundraising Via Issue Of Securities On Pref Basis On February 4
Sponsored Links
Newsboard
- Analysts bet on aviation despite weak Q1; InterGlobe, Jet up
- A. Balasubramanian on Macro view of India's Economic Growth
- Tree House rallies as board approves merger with Zee Learn
- Commercial vehicles: Truck rentals fall 3.5% in August 2016
- Gujarat Industries power purchase agreement with GUVNL expires
- S&P upgrades Tata Motors’ long-term corporate rating
- Sunil Kant Munjal ceases to be promoter of Hero MotoCorp
- Suzlon Energy gains on winning order
- 6:23 PM Hope for double-digit revenue run rate by Q4FY17: Just Dial
- 6:02 PM Why investors can stop freaking out over the Fed, in three words
- 5:43 PM Two Fed rate hikes 'conceivable' in 2016, Sept in play: Lockhart
- 5:40 PM Dish TV, Videocon D2H in final stages of merger deal: Sources
- 5:32 PM Cisco Systems to lay off about 14,000 employees: Report
- 5:32 PM Ready to Talk on Terror Not on Kashmir: India Tells Pakistan
- 5:32 PM The knowledge you need to take your SME ahead
- 5:32 PM Click here for the best real estate investment advice
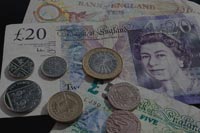
Life after Brexit
A new survey has found that UK has seen a dramatic fall in economic output and business activity since the Brexit vote
Why sovereign ratings matter
Year 2016 could set a new record for negative sovereign rating actions
Changing faces of rain gods
With monsoon having covered the entire country by mid-July, the outlook for the agricultural sector appears to be improving
- 20-Aug-2016 Brexit will create uncertainty but may not hit IT cos much: Pros
- 20-Aug-2016 Common sense, wisdom main ingredients in stock picking: Veliyath
- 19-Aug-2016 One needs to have guts to take contrarian market bets: Emkay
- 19-Aug-2016 Dish TV, Videocon D2H in final stages of merger deal: Sources
- 19-Aug-2016 Cisco Systems to lay off about 14,000 employees: Report
- 18-Aug-2016 Ready to Talk on Terror Not on Kashmir: India Tells Pakistan
- 17-Aug-2016 The knowledge you need to take your SME ahead
- 17-Aug-2016 Click here for the best real estate investment advice
Views & Recommendations
Performance
Equipments
737 Cr. (6.99%)
Petrochemicals
74,010 Cr. (1.8%)
Hospitality
42,746 Cr. (1.65%)
 Market Movers


pay demat dues online
Axis Bank
579.801.85
Infosys
1,016.35-4.95
SBI
255.70-3.75
Sun Pharma
808.25-13.75
TCS
2,548.70-54.80
Kotak Select Focus Fund - Regular (G)
25.9750.06
Birla SL Frontline Equity (G)
180.830.14
SBI Blue Chip Fund (G)
31.9180.02
Principal Emerging Bluechip (G)
80.110.37
SBI Magnum Multicap Funds (G)
37.5920.14
Copper Spt 25,2016
318.10-4.05
natural gas Spt 24,2016
177.102.1
crude oil Spt 23,2016
3231.00-61
Silver Spt 22,2016
44726.00-718
gold Spt 21,2016
31285.00-119
Chat

Mark Allen
investments in fixed income
Head funds & fixed income research, CRISIL (25 Sep 2016 - 20:00hrs)
Chat Now
international markets